
Power BI Development Services for Growing Businesses
Turn disconnected business data into clear, actionable reporting. Cognic Systems helps growing businesses build custom Power BI dashboards, automate reporting workflows, connect enterprise data sources, and maintain reliable BI solutions.
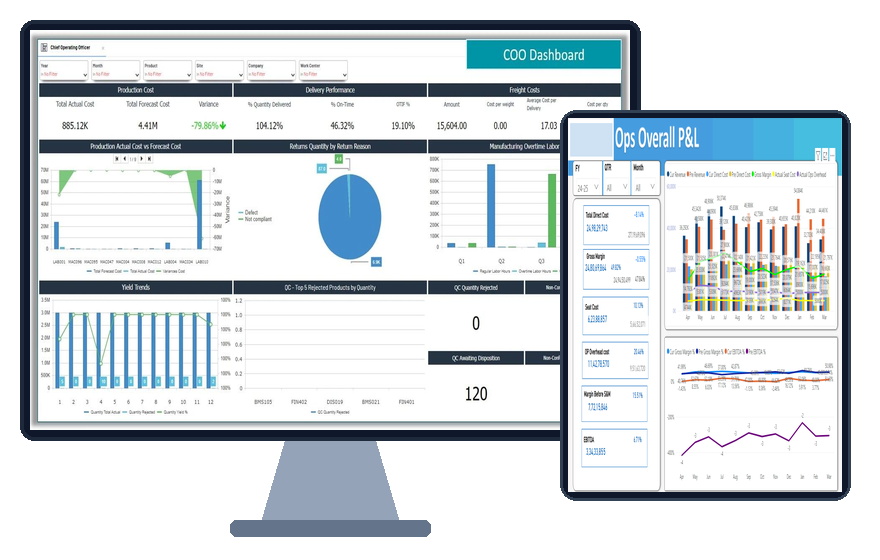
End-to-End Implementation
From planning & data modeling to deployment
Enterprise Integration
SQL Server, Azure, ERP, CRM, Cloud Warehouses
Flexible Engagements
Fixed projects, dedicated developers & support
White-Label Ready
Trusted delivery partner for tech agencies & consultancies
Comprehensive Power BI & Analytics Solutions
Specialized Power BI development, data architecture, and Microsoft Power Platform consulting delivered by Cognic Systems.
Custom Dashboard Development
Tailored interactive dashboards designed around executive KPIs, departmental workflows, and business goals.
Discuss This Service →Data Modeling & Transformation
Star-schema architectures, Power Query ETL pipelines, and high-performance DAX measure engineering.
Discuss This Service →Power BI Integration & Implementation
Connecting Power BI to SQL Server, Azure, PostgreSQL, Oracle, Salesforce, ERPs, and cloud data warehouses.
Discuss This Service →Real-Time Data Analytics
DirectQuery and streaming datasets for operational visibility and up-to-the-minute business decision making.
Discuss This Service →Embedded Power BI Solutions
Securely embedding interactive reports directly into custom portals, SaaS web apps, and enterprise intranets.
Discuss This Service →Performance Optimization
Diagnosing slow report rendering, refactoring complex DAX queries, reducing model size, and tuning scheduled refreshes.
Discuss This Service →Migration from Legacy BI Systems
Seamless migration from Excel workbooks, SSRS, Tableau, Qlik, and older reporting tools into modern Power BI.
Discuss This Service →Power Automate & Power Apps Integration
Extending dashboards with automated alert workflows, data write-back forms, and Microsoft Power Platform apps.
Discuss This Service →Solving Real Business Challenges Across Departments
We organize Power BI development around operational, financial, and strategic business outcomes — not just technology names.
Production & Operations
Monitor production output, cost variances, OTIF delivery rates, machine yield, scrap rates, and labor overtime to eliminate operational bottlenecks.
Sales & Pipeline Governance
Gain real-time visibility into bid win rates, deal velocity across approval stages, contract renewal margins, and sales rep quota attainment.
Finance & Profitability
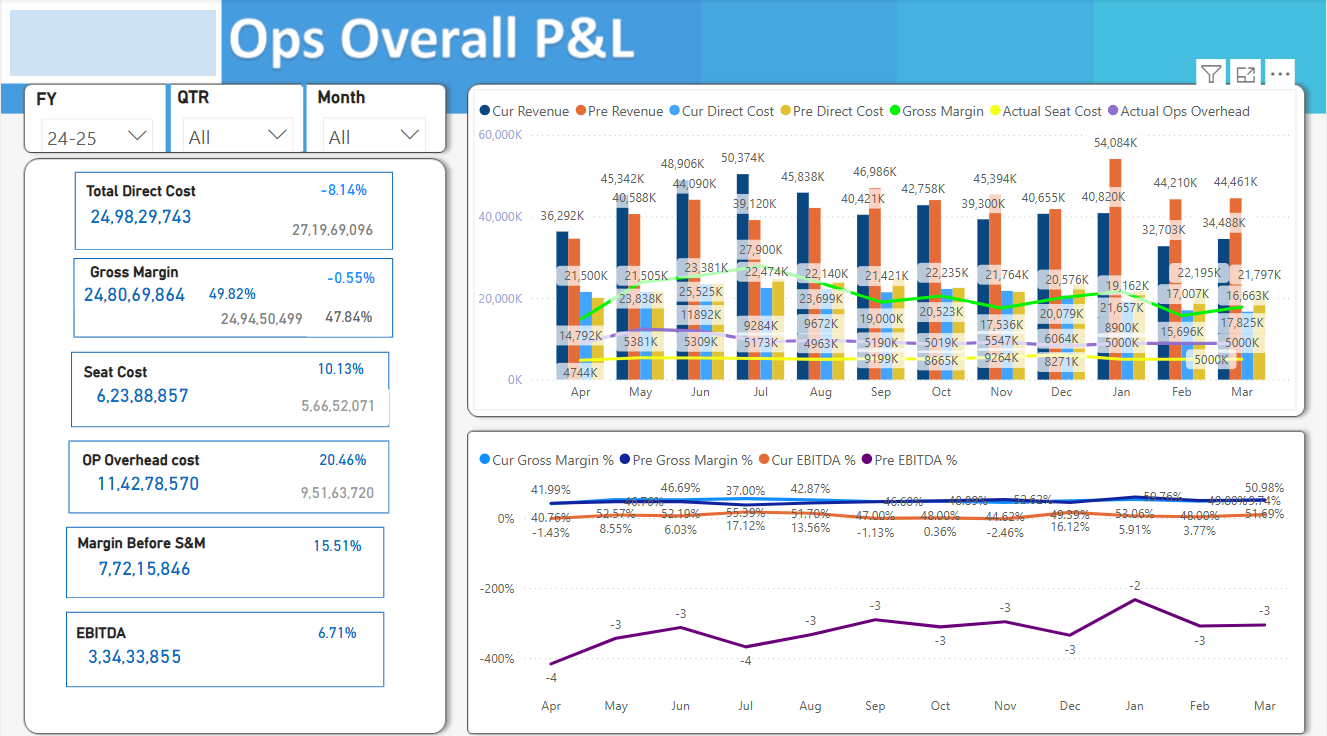
Consolidate P&L performance, direct costs, gross margins, EBITDA, seat costs, and operational overhead into actionable financial reporting views.
Healthcare Analytics
Track patient length of stay, average waiting times, payer mix distribution (Medicare/Private), and treatment costs under strict data privacy protocols.
Power BI Dashboard Examples
Explore illustrative dashboards showing how Power BI can support production, sales, finance, and healthcare reporting. Examples use synthetic data.
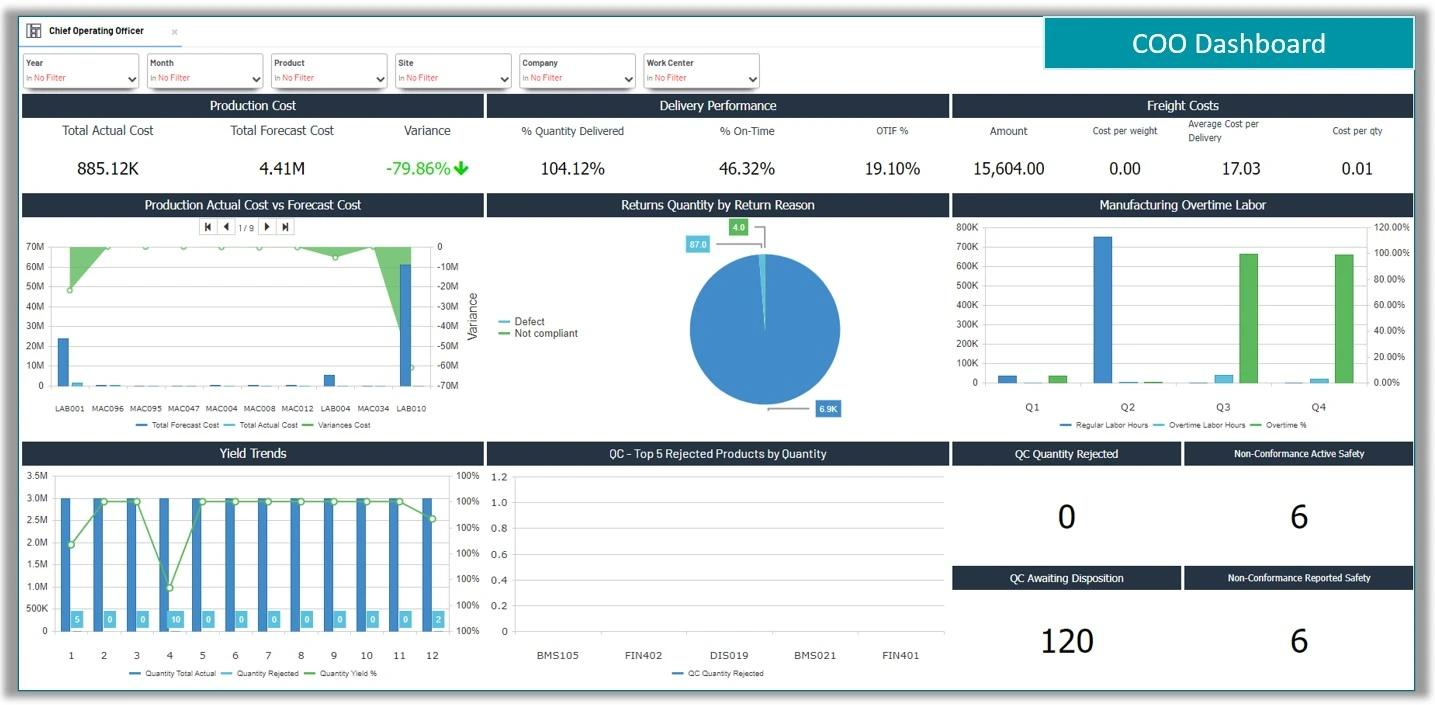
Production & COO Operations Dashboard
Business Questions Answered:
How are actual production costs tracking against forecast? What is our On-Time In-Full (OTIF%) and delivery quantity performance? What are our yield trends across machine lines and top rejected products? Are manufacturing overtime labor costs spiking?
Visible KPIs & Capabilities:
Total Actual Cost vs Forecast ($885.12K vs $4.41M, -79.86% Variance) • Quantity Delivered (104.12%) • On-Time % (46.32%) • OTIF % (19.10%) • Freight Costs • Manufacturing Overtime Labor by Quarter • Yield Trends • Top 5 QC Rejected Products.
Potential Applications:
COO operational oversight, manufacturing plant performance monitoring, scrap and defect reduction, freight and overtime cost control.
Sales Performance & Deal Governance Dashboard
Business Questions Answered:
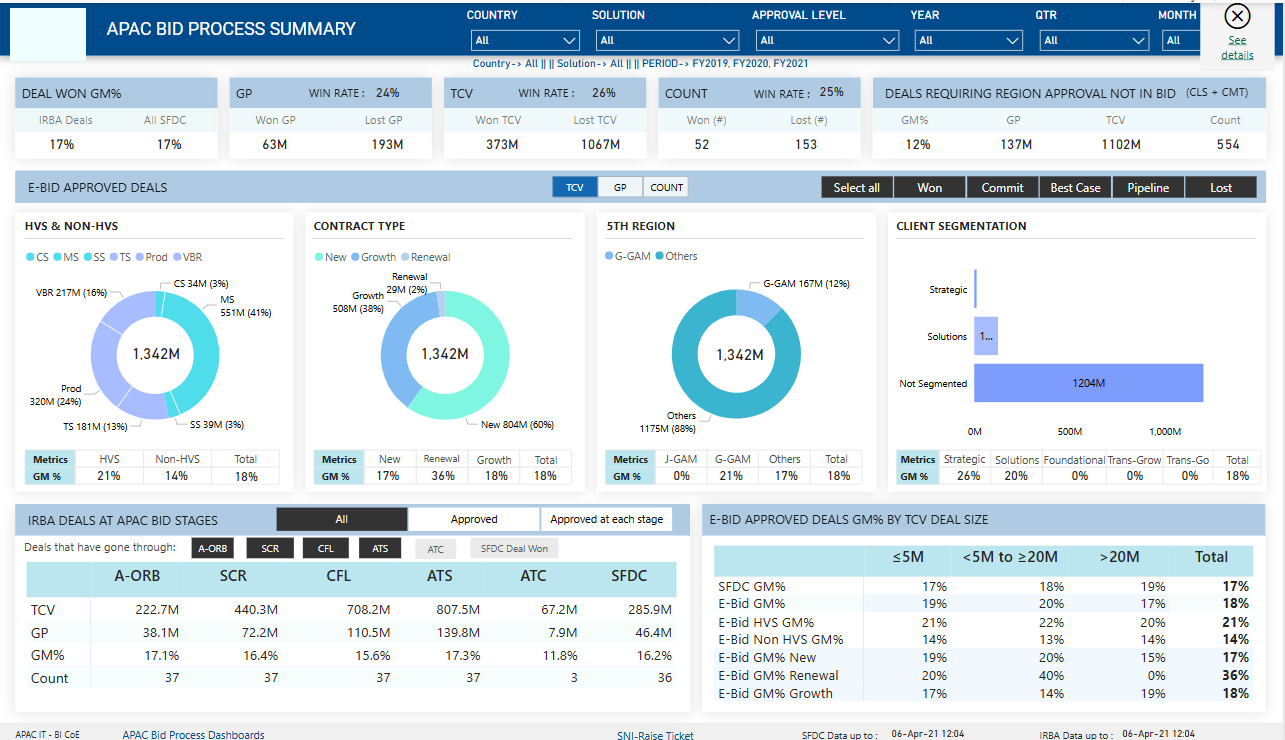
What is our overall bid win rate and total contract value (TCV) across regions? How is gross margin (GM%) performing across new contracts, renewals, and growth deals? Which client segments drive the highest margins? Which deals require regional executive approval?
Visible KPIs & Capabilities:
Deal Won GM% (17%) • Win Rate by Value (24%) & Count (25%) • Total Contract Value ($373M Won / $1,067M Lost) • Contract Type Breakdown (New $604M, Renewal $29M, Growth $508M) • Client Segmentation • Region Approval Matrix.
Potential Applications:
Enterprise sales management, commercial bid desk governance, contract profitability tracking, executive pipeline reviews.
Sales Process & Pipeline Velocity Dashboard
Business Questions Answered:
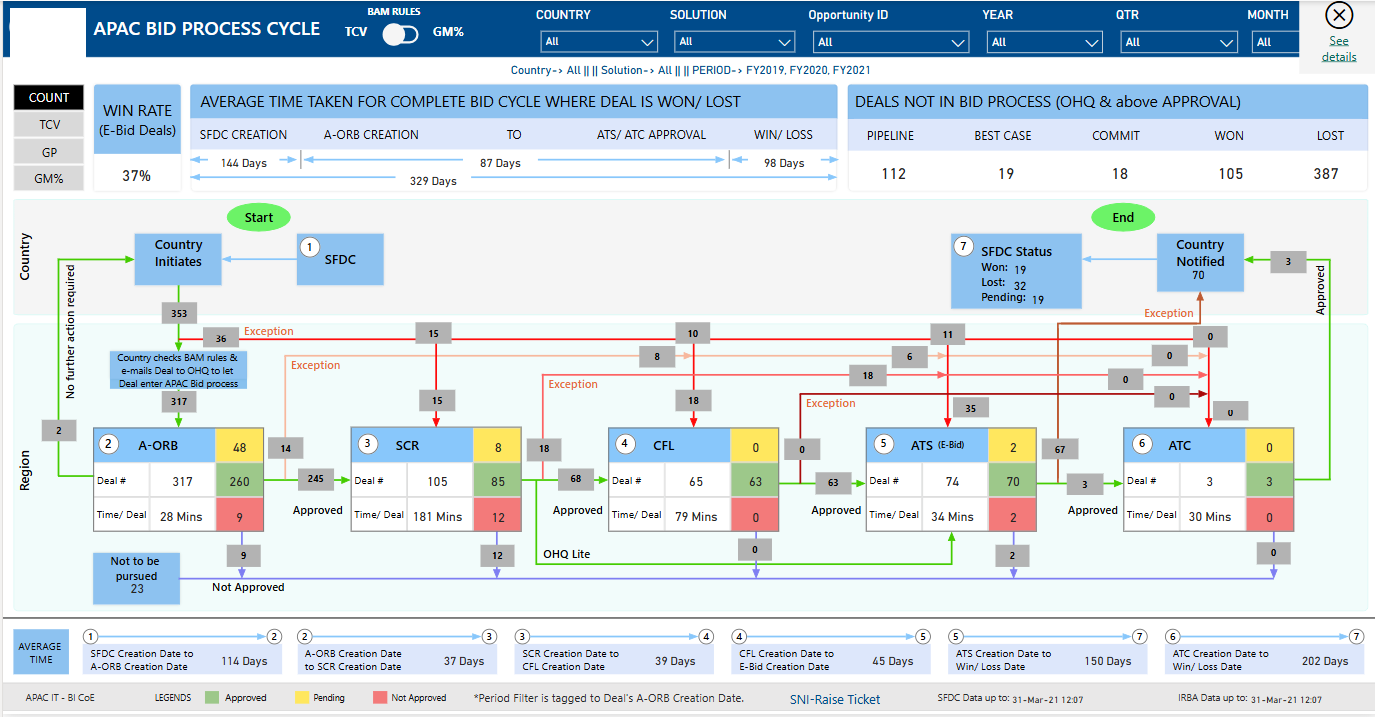
Where are deals getting delayed in the end-to-end sales cycle? How many days does each bid approval stage take from CRM creation to win/loss? Which regional exceptions are holding up deals? How many deals are in active pipeline vs commit?
Visible KPIs & Capabilities:
Complete Bid Cycle Duration (Average 329 Days breakdown: SFDC Creation 144d, A-ORB Creation 87d, ATS/ATC Approval 98d) • Visual Workflow Map with status indicators (Approved, Pending, Exception) • Deal Stage Velocity (Time per deal in minutes/days).
Potential Applications:
Sales operations cycle acceleration, bid process bottleneck identification, CRM process compliance, executive deal velocity tracking.
Financial Performance & Consolidated P&L Dashboard
Business Questions Answered:
What is our consolidated gross margin and EBITDA? How do monthly direct costs and revenue track against prior periods? What is our operating seat and overhead cost? How are margins before Sales & Marketing (S&M) performing?
Visible KPIs & Capabilities:
Total Direct Cost (with YoY variance -8.14%) • Gross Margin (49.82%, with detailed breakdown) • Seat Cost • OP Overhead Cost • Margin Before S&M • EBITDA (6.71%) • Monthly Actual vs Prior Revenue & Cost comparison.
Potential Applications:
CFO executive financial reviews, board reporting, departmental cost management, budget vs actual variance analysis.
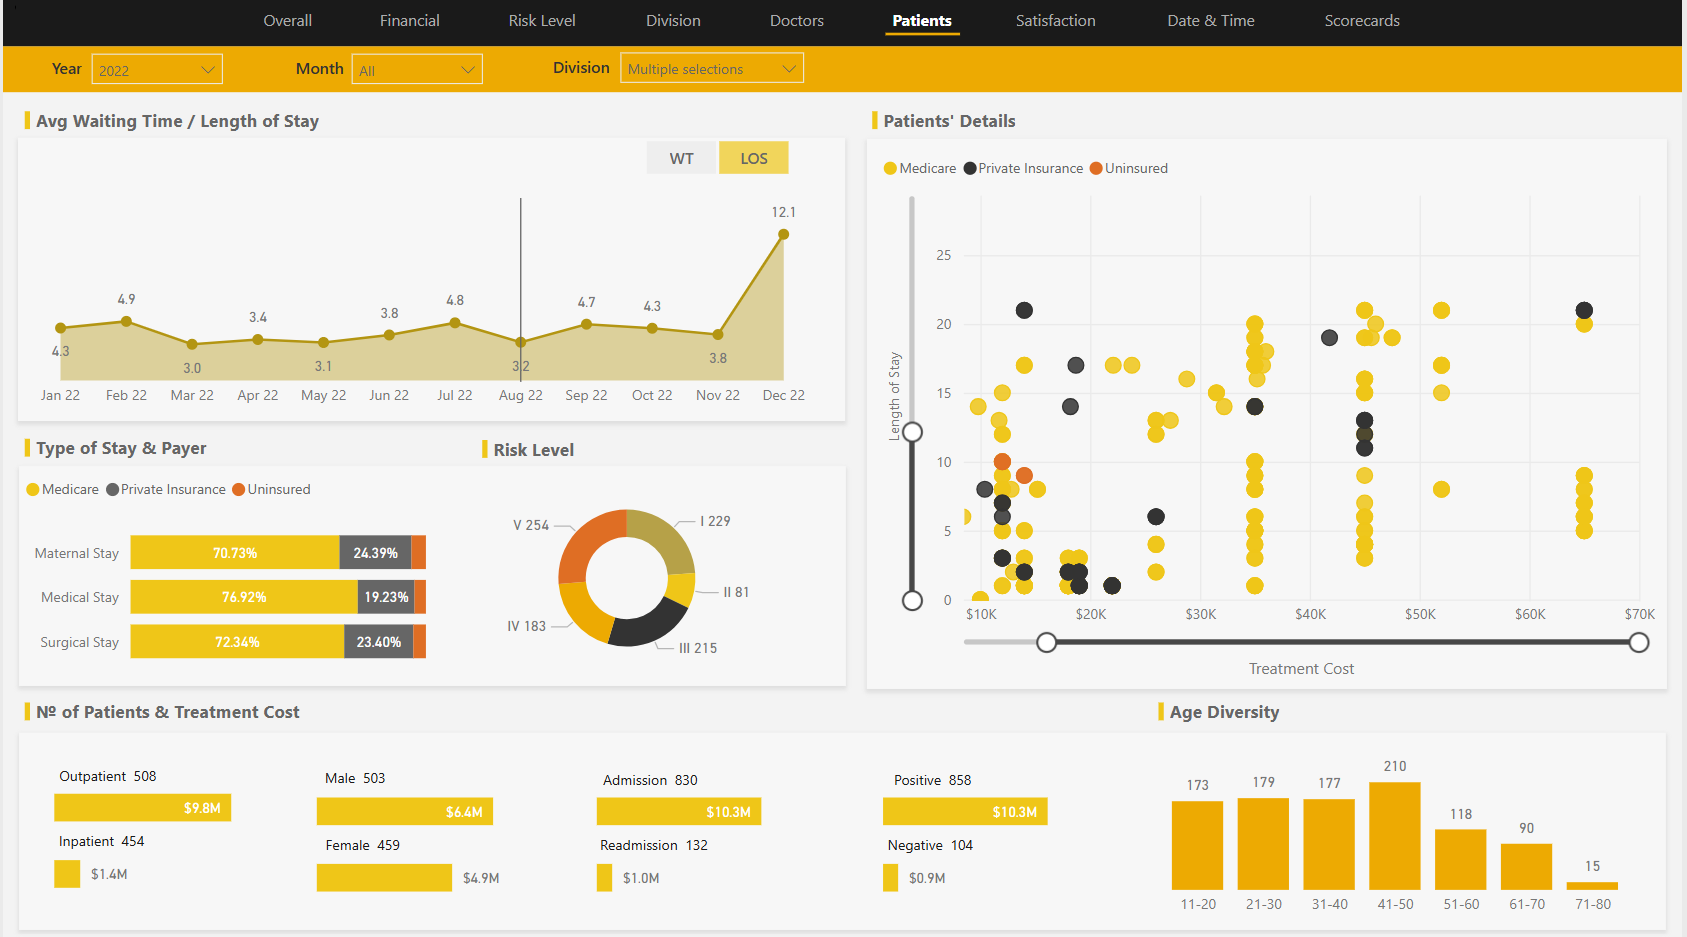
Healthcare Analytics & Patient Flow Dashboard
Business Questions Answered:
What is the average patient waiting time and length of stay (LOS)? How is revenue distributed by payer (Medicare, Private Insurance, Uninsured)? How do treatment costs correlate with patient stay duration? What is the patient age and risk level distribution?
Visible KPIs & Capabilities:
Monthly Average Waiting Time vs Length of Stay (WT/LOS) • Payer Mix Breakdown (70.7% Medicare, 23.4% Private, Uninsured) • Treatment Cost vs LOS Scatter Plot • Inpatient vs Outpatient Cost Split ($9.8M Outpatient / $1.4M Inpatient) • Risk Level Donut (I-V).
Potential Applications:
Hospital operational efficiency, patient-flow management, payer revenue cycle optimization, clinical care compliance.
Agile Delivery, Daily Transparency, Rapid Sprints
We use agile development, daily scrums, daily client progress reports, and two-week sprint planning meetings to ensure your project is delivered on time and with the highest quality.
Preparation & Sprint Planning
We establish the business case, define KPI goals, review data schemas, and formulate a sprint backlog.
Daily Scrums & Client Progress
Daily stand-ups, transparent progress reporting, and continuous blocker resolution keep delivery on track.
Two-Week Sprint Iterations
Agile sprint cycles with hands-on dashboard reviews, DAX measure validation, and stakeholder alignment.
Deployment & User Enablement
Workspace security configuration, scheduled refresh automation, documentation handover, and ongoing support.
Enterprise Power Platform & Database Integration
We connect Power BI to SQL Server, Azure SQL, PostgreSQL, MySQL, MongoDB, Oracle, Salesforce, ERPs, and the Microsoft Power Platform ecosystem.
Extend Your BI Delivery Capacity Behind Your Brand
Cognic Systems acts as a seamless behind-the-scenes Power BI delivery partner for IT consultancies, software houses, and MSPs that require specialized BI engineering without the overhead of scaling an in-house team.
Cognic Systems Global Delivery Locations
Providing dedicated Power BI consulting across North America, Asia-Pacific, and global markets.
United States — Texas Office
111 Walking Horse Way, Cedar Park, TX 78613
+1 512-843-3234India — Development Center
Plot No 22, Technopark, Bargi Hills, Jabalpur, MP
+91 9926 356 405Australia — Melbourne Operations
Melbourne, Australia
info@cognicsys.comYour Questions About Our Power BI Services, Answered
Let’s Discuss Your Power BI Project
Tell us about your reporting challenges, data sources, or delivery requirements. We’ll discuss the right approach for your business.
What to Expect Next
Technical Scoping within 24h
We review your data architecture, reporting needs, and deliver a clear scoping summary within 1 business day.
Direct BI Architect Consultation
Discuss your goals directly with seasoned Power BI engineers and data architects, not junior salespeople.
Enterprise NDA & Security
Standard mutual NDA execution before data access. Complete Row-Level Security (RLS) governance.
Cognic Systems Inc.
📍 2055 Limestone Rd, STE 200-C, Wilmington, DE 19808
📞 +1 (609) 366-0004
✉ contact@cognicsys.com